How to work out your reorder point
The formula, the z table, a worked example, and the three cases where this formula quietly gives you a wrong answer. There is a calculator below, but the point of this page is that you can do it on paper afterwards.
Where this formula is confidently wrong
It assumes demand over the lead time is roughly Poisson and roughly steady. A weekend-only SKU, a seasonal line, and a product with less history than its own lead time all break that assumption, and the arithmetic still hands you a clean-looking number.
The formula
safety stock = z × √(demand per day × lead time)
Three inputs, and each one is worth being careful about:
- Demand per day — units sold ÷ days in the period. Use a period long enough to cover at least one lead time, and count the days the shop was actually open.
- Lead time — the days between placing the order and the stock being sellable on your shelf. Not the number your supplier quotes: add their handling, customs, and your own receiving. Most people underestimate this, and it is the input the answer is most sensitive to.
- Service level — the share of lead times you are willing to get through without running out.
zcomes from it:
| Service level | z | Means |
|---|---|---|
| 90% | 1.28 | You accept running out in about 1 lead time in 10 |
| 95% | 1.65 | About 1 in 20 — the usual starting point |
| 98% | 2.05 | About 1 in 50 |
| 99% | 2.33 | About 1 in 100 — expensive, and rarely worth it below a high-margin bestseller |
The reorder point is when to order, not how much. When stock on hand plus stock already on order falls to this number, you place the order.
Work out yours
This runs in your browser. Nothing is sent anywhere — the page is blocked from making network requests at all, which you can check by turning your internet off and reloading.
This calculator is the textbook formula. If any of the three cases below apply to your catalogue, the number you just worked out by hand is wrong. And you have just done it for one SKU: the same arithmetic has to be redone for each of them, every week, as the rates move, and that is the part that stops happening.
Why safety stock uses a square root
This is the part most sources get wrong, and getting it wrong is expensive in a way nobody notices. It does not cause a stockout, it just quietly parks your cash in a warehouse.
Demand over a lead time is a count of events: so many orders arrive, each for a unit or two. Counts like that follow a Poisson distribution, and the defining property of a Poisson distribution is that its variance equals its mean. The standard deviation is therefore the square root of expected demand — not a percentage of it, and not proportional to it.
variance = 150 → standard deviation = √150 = 12.2
safety stock = 1.65 × √150 ≈ 20.21 → round up to 21 units
So doubling your lead time does not double the buffer you need — it multiplies it by about 1.41 (that is √2). Demand over the window doubles, but the uncertainty around it grows only by the square root. Here is the same SKU at four lead times, buffered both ways:
| Lead time | Expected demand | Safety stock, correctly (z√demand) | If you scaled it linearly | Extra cash tied up |
|---|---|---|---|---|
| 15 days | 75 | 15 | 11 | Under-buffered by 4 units |
| 30 days | 150 | 21 | 21 | 0 |
| 60 days | 300 | 29 | 42 | 13 units |
| 120 days | 600 | 41 | 84 | 43 units |
Both columns round up to whole units. The linear column scales the rounded 30-day buffer of 21 units with lead time. At a 120-day lead time it holds 84 units against the formula’s 41. On one SKU that is 43 extra units tied up; the reason it matters is that you apply this rule to every SKU you stock, and a container-shipped catalogue is mostly long lead times.
The same arithmetic runs the other way at short lead times: scaling down linearly leaves you under-buffered on fast-turning items, which is where stockouts actually happen.
A worked example
One SKU, every step visible, so you can repeat it in a spreadsheet.
SS-CREAM-50. Sold 450 units over the last 90 open days. Your supplier ships in 21 days, but with their handling and your receiving it is realistically 30. You want to get through 95% of lead times without running out.
2. lead-time demand = 5 × 30 = 150 units
3. z at 95% = 1.65
4. safety stock = 1.65 × √150 ≈ 20.21 → round up to 21 units
5. reorder point = 150 + 21 = 171 units
When on hand plus on order drops to 171, place the order. The 21 units of safety stock buffer demand above the expected 150 units during delivery. They do not guarantee that stock will last.
How much to order is a different question
The reorder point tells you when. The quantity depends on how often you review stock — if you check weekly, each order has to cover the lead time and the week until you look again:
− (on hand + already on order)
For SS-CREAM-50 on a weekly review, cover all 37 days when sizing the buffer too: 1.65 × √185 ≈ 22.44, rounded up to 23 units. With 12 units on hand and nothing on order: 185 + 23 − 12 = 196 units. Then round to your supplier's case size.
Three ways this formula misleads you
The arithmetic above is correct and still gives a badly wrong answer in three common cases. All three are measured failures, not hypotheticals — the numbers come from building the tools on this site. The first one is written up in full, with the arithmetic, in why stockout cost calculators overstate losses.
1. A product that only sells on certain days has no "per day" rate
Divide a weekend product's sales by seven and you get a number that describes no day of its life. The formula then treats five quiet weekdays as demand you failed to meet.
Measured: a Saturday-only SKU selling 1,040 units a year was scored as 6,122 units lost — 5.9× everything it had ever sold.
Do instead: compute the rate over the days it actually sells, and count your lead time in those days too. A 30-day lead time is about 8 Saturdays, not 30.
2. Days you were closed look exactly like a stockout
A public holiday, a site outage, a tracking gap — the data is identical to being out of stock: zero units sold. Left in, they drag your daily rate down and inflate what looks like lost demand.
Measured: one Thanksgiving weekend produced about $2,577 of phantom loss per SKU, spread across an entire catalogue.
Do instead: before anything else, throw away every day on which your whole shop sold nothing. One SKU at zero is a signal; all of them at zero is a closure.
3. A discontinued product still has a demand history — and the formula will happily restock it
This is the expensive one. The formula only looks at units sold ÷ days. A product you stopped selling four months ago still has a rate, so it still gets a reorder point, and if the on-hand number is low it reads as "order more". Nothing in the arithmetic knows the product is dead.
Measured: during development, a reorder tool recommended restocking a discontinued SKU that was already sitting on 400 dead units — a five-figure write-off, generated by correct arithmetic.
Do instead: before sizing anything, check whether the SKU sold at all in the recent half of your history. If it did not, it gets no reorder point and no order quantity — not a small one. Seasonal products fail this test too, and that is the right outcome: size them from last season, by hand, with your judgement in the loop.
If you want to see where availability already cost you before you change anything, the free stockout cost calculator takes the same orders export and prices the gaps — with all three of the corrections above applied. See it run on sample data if you do not have an export handy.
If you would rather not do this per SKU every week
The formula and calculator above are free, and doing it by hand for your top twenty SKUs is a perfectly reasonable afternoon. It is the every week, for every SKU, with the three corrections applied part that stops happening. That is what the paid tool is for. It earns its keep fastest where your lead time is long, because that is where a wrong call stays wrong for months and where buffering it the wrong way ties up the most cash. The table above is that argument in units.
You give it your order history and your stock levels; it produces the decision, not a dashboard:
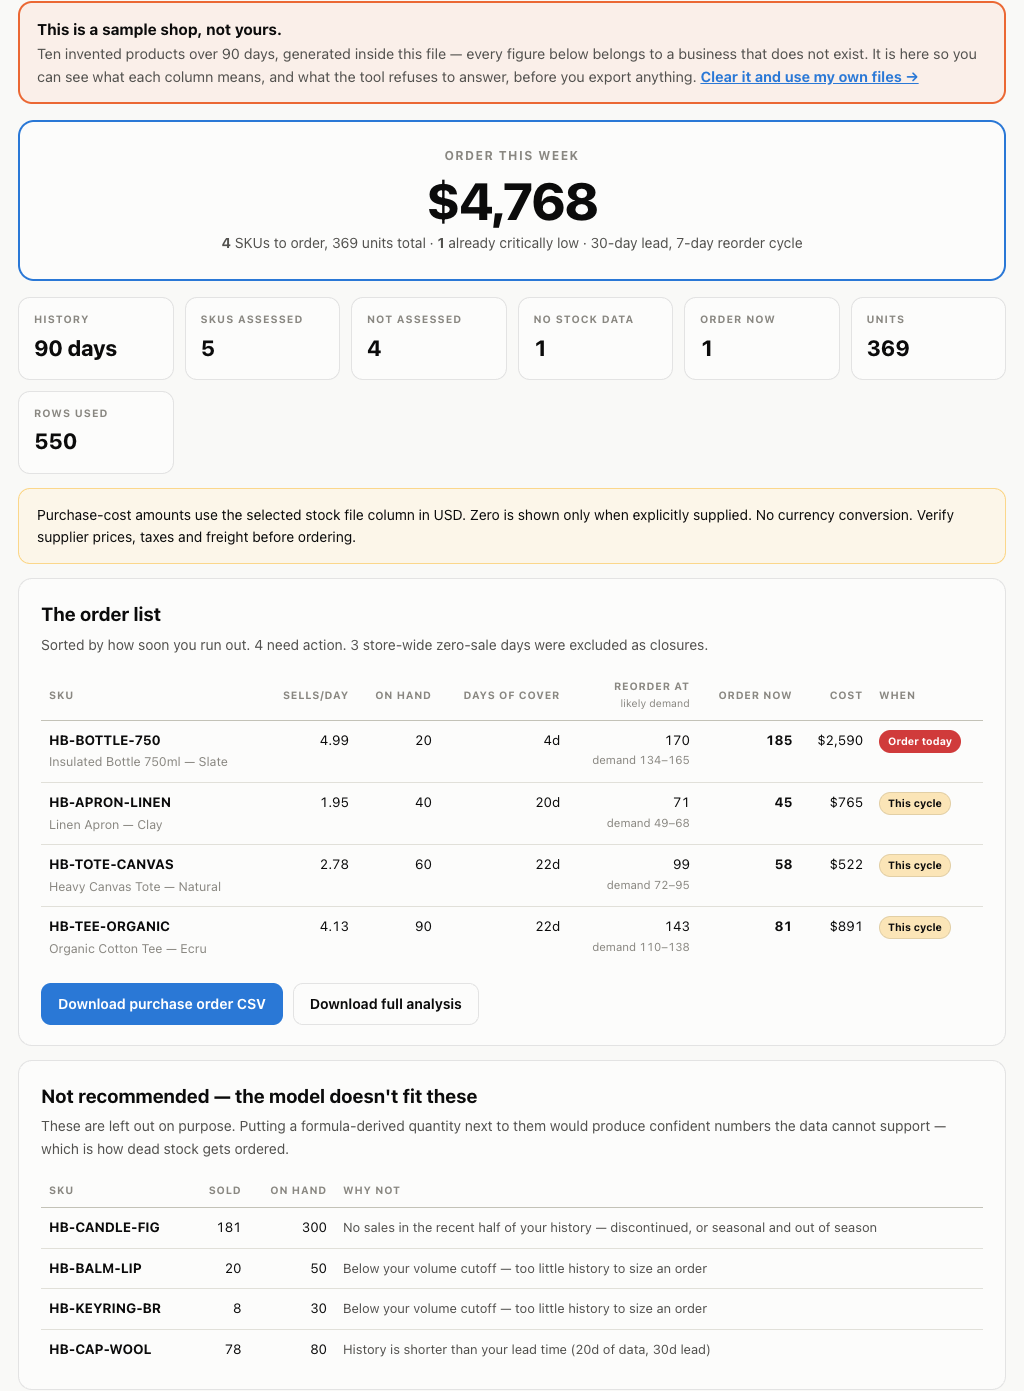
The paid tool on the sample shop built into the file — ten invented products, there so you can see what every column means before you export anything. Its census reads 5 assessed, 4 not assessed, 1 with no stock data: four of the five assessed need an order this week and the fifth is adequately stocked, so it needs no line. The other five are held back, and the reason is printed beside each — which is the part a formula that answers for every SKU does not do.
Those five held-back rows are the ones worth reading, so here they are as text rather than as pixels in the picture above — the same five, from the same run:
| SKU | Sold | On hand | Why it gets no order quantity |
|---|---|---|---|
| HB-CANDLE-FIG | 181 | 300 | No sales in the recent half of your history — discontinued, or seasonal and out of season |
| HB-CAP-WOOL | 78 | 80 | History is shorter than your lead time (20d of data, 30d lead) |
| HB-BALM-LIP | 20 | 50 | Below your volume cutoff — too little history to size an order |
| HB-KEYRING-BR | 8 | 30 | Below your volume cutoff — too little history to size an order |
| HB-NOTE-A5 | 172 | — | Not in the stock file — check this one by hand, or re-export your inventory with it included |
Note the third and fourth rows: two SKUs refused for the same reason, which is what an honest refusal list looks like. And note HB-CANDLE-FIG — 300 units on hand and no recent sales. A tool that sized an order for it would have you buy more of the thing you cannot sell.
Export purchase-order.csv with quantities and days of cover, then review it before sending it to your supplier. Costs and line totals appear only when you provide valid purchase unit costs. Selling prices are not used as costs. The sample includes a supplied cost column in USD; standard Shopify inventory exports do not include that column. Missing costs stay blank in the CSV, and an incomplete order cost is not shown as a total.
Every weekday gets its own rate, whole-shop zero days are discarded first, safety stock uses the square root, and any SKU with no sales in the recent half of your history is refused an order quantity rather than given a small one. Each SKU it declines to size is listed with the reason — nothing is silently dropped.
If the first run doesn't tell you something useful about your own catalogue, ask for a refund and keep the file. I would rather that than have you argue with me about it.
What you need — two exports, each one menu item you already have: Orders → Export → CSV and Products → Inventory → Export. No app to install, no API key, no account here.
Pull as much history as you can. A year rather than ninety days. Every SKU is judged against the file you hand it, so a longer export is the cheapest way to get more of your catalogue answered.
Which SKUs get a quantity. The ones that sold at least 25 units in that file, have been on sale for longer than your lead time, and were still selling in the recent half of it — and that cutoff is a control you can drop to 10. Everything else comes back not assessed, with the reason printed beside it, because the data cannot support an answer and the tool does not invent one.
Costs are optional. The two standard exports are enough for quantities. To calculate purchase costs, add a genuine unit-cost column from your records and choose its currency. There is no currency conversion.
Without the stock file you still get reorder points, but no order quantities — and the quantities are the part the free calculator above cannot do for you.
Instant download · free updates within v1.x · sold by Lemon Squeezy as merchant of record — what you are buying, and what you may do with it.
No server. That is the whole architecture.
One HTML file. Your order history and stock levels are read by JavaScript already in your browser and go nowhere — the file ships a Content-Security-Policy of default-src 'none', so the browser blocks every outbound request. Turn off your internet and it works identically. There is nothing to cancel and no vendor who can raise your price later.
Honest comparison
| Reorder Copilot | A typical inventory app | |
|---|---|---|
| Price | $49 once | $50–290 / month, forever |
| Setup | Two CSVs, no account | OAuth, sync, onboarding |
| Live sync with your store | No — you re-export when you reorder | Yes |
| Multi-warehouse allocation | No | Usually |
| Supplier MOQ / price breaks | No | Sometimes |
| Your data leaves your machine | Never | Yes, by design |
| Refuses to guess | Yes, and says why | Rarely |
If you reorder weekly from one location and a re-export is no burden, the monthly fee buys you convenience you may not need. If you run multiple warehouses or need live sync, buy the app instead — this is not trying to be that, and saying so is cheaper for both of us than a refund.
Not for you if
- You dropship or print on demand — there is no reorder decision here to make
- Your catalogue is almost entirely seasonal, or you retire and launch SKUs constantly — a SKU has to have been selling for longer than your lead time, and to still be selling now, or it is refused a quantity
- Your main sellers sold fewer than about 25 units in the longest export you can pull — below that the tool declines to size them rather than guessing, and the cutoff only drops as far as 10
- You need multi-location allocation or supplier MOQ optimisation
- You want a dashboard to look at rather than an answer to act on
Two CSV exports, each one menu item: Orders → Export → CSV and Products → Inventory → Export. Nothing to install.
Instant download · sold by Lemon Squeezy as merchant of record · 30-day refund, and you keep the file.
You now have the level to reorder at. The question it does not answer is what the times you were already out have cost you — which is measurable from an orders export you already have.
Stockout Cost →Requirements
Order history CSV with a date, a SKU and a quantity — Shopify, Amazon, WooCommerce, or your own spreadsheet. On Shopify that is Orders → Export → CSV; on a large store Shopify sends the file by email rather than downloading it there and then. Stock on hand CSV (Products → Inventory → Export) is optional, but needed for order quantities rather than just reorder points. Any modern browser. No installation.